Analytics & BI
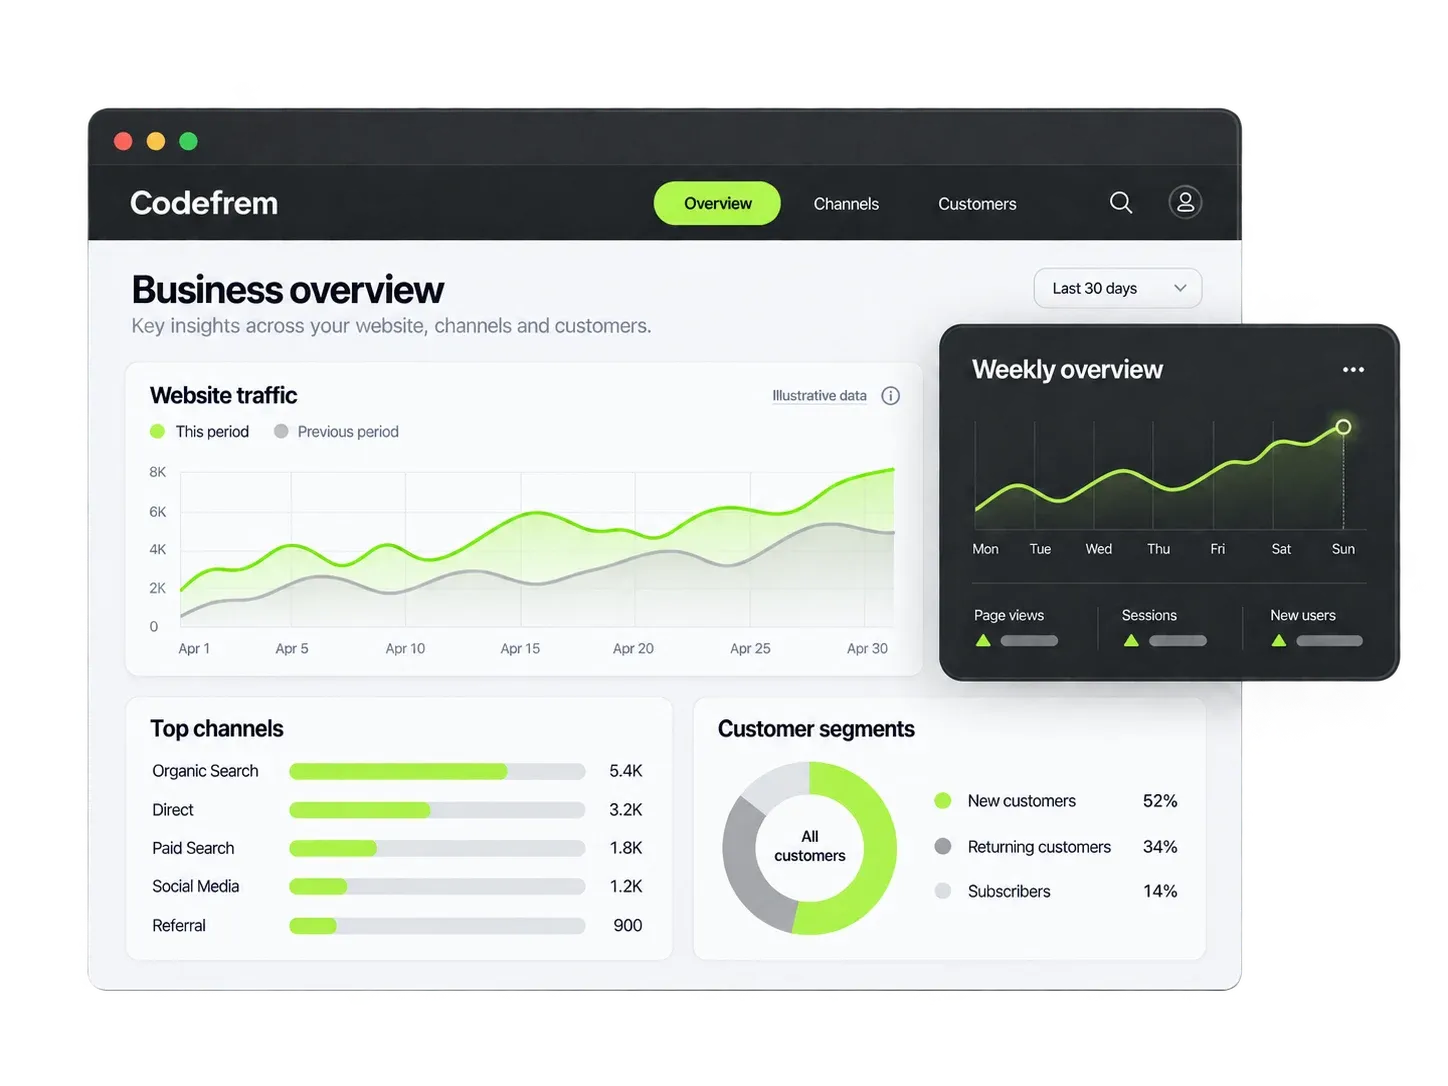
See your numbers clearly, finally.
We turn scattered spreadsheets and disconnected tools into one clear picture of your business. You get reports people actually open, and decisions you can defend with data.
Analytics work begins with the decisions your team needs to make and the meaning of each business metric. We inventory your spreadsheets and systems, check data quality, and agree definitions for measures such as revenue, retention, or pipeline. A shared model reduces disagreements caused by reports using different filters or time periods.
We build the agreed dashboards with useful filters, drill-downs, refresh schedules, and role-appropriate access. Figures are reconciled against source data before handover, and your team receives guidance on interpreting and maintaining the reports. Data-source availability, licensing, historical backfills, and new reporting requests are included only where specified in the proposal.
Built around your problems
Every line item below exists because a client once paid the price of not having it.
One source of truth
Sales, operations and marketing data unified in one place. No more three versions of the same number in three files.
Dashboards people open
KPI views designed for decisions, not decoration. The number you need, visible in five seconds.
Reports that refresh themselves
Automated updates on a schedule. Nobody exports CSVs on a Friday afternoon ever again.
Answers, not just charts
We explain what the numbers mean for your business; the 'so what' is included, not extra.
Works with what you have
We connect to your existing stack: Excel, Google Sheets, your CRM, your database. No forced migrations.
Your team becomes self-sufficient
A walkthrough session plus documentation, so you can tweak and extend dashboards without calling us.
Our stack
Pick a plan
Clear scopes, fixed prices. Every plan can be tailored: the quote you approve is the invoice you pay.
$700
Your first dashboard people actually open.
- Up to 3 data sources
- One KPI dashboard
- Automated weekly refresh
- Walkthrough session
$1,200
The whole business in one place.
- Up to 6 sources unified
- Role-based dashboards (×3)
- Daily refresh + failure alerts
- Docs + team training
$2,200
Data-driven operations, end to end.
- Unlimited sources
- Custom metric warehouse layer
- Full history backfilled
- 3 months of insight reviews
$700
2-3 weeks
Final quote depends on scope: you always get a fixed price before we start, so there are no surprises.
Questions clients ask
How is our data kept safe?
Your data stays in your accounts and infrastructure. We work with access you grant and can revoke, sign NDAs routinely, and never copy business data to our own machines.
Do we need to change our systems?
No. We build on top of what you already use: spreadsheets, CRMs, databases. The only change is that everything finally flows into one place.
Can this connect to our CRM or billing tool?
Almost certainly. We've connected CRMs, invoicing tools, ad platforms, e-commerce backends and plain old exports. If it has an API or a CSV, we can ingest it.
What if our data is a mess?
That's the normal starting point; cleaning it is half the job and fully included. We'll show you exactly what we fixed so the same mess doesn't regrow.
LET’S WORK TOGETHER
Ready to get started?
Tell us about your analytics & bi project; we reply within a day.